How to Activate Advanced Monitoring on my Cloud server with SWPanel and view its Dashboard.
Applicable to: Cloud with SWPanel Administration Panel.
cta:cloud_app_swpanel_smart_d5
While Basic Monitoring performs Pings against your Cloud, Advanced Monitoring goes further, monitoring the following services:
- Ping
- FTP service
- DNS service
- WEB service
- HTTP monitoring
- HTTPS monitoring
- Monitoring for Apache
- Monitoring for IIS
- Analysis of 2 URLs
- Content
- Response time
- MsSQL service
- MySQL service
- POP service
- SMTP service
- IMAP service
- Connection up to 4 TCP ports
- CPU usage
- Memory Usage
- Disk space / partitions
All this with just 4 easy steps from SWPanel.
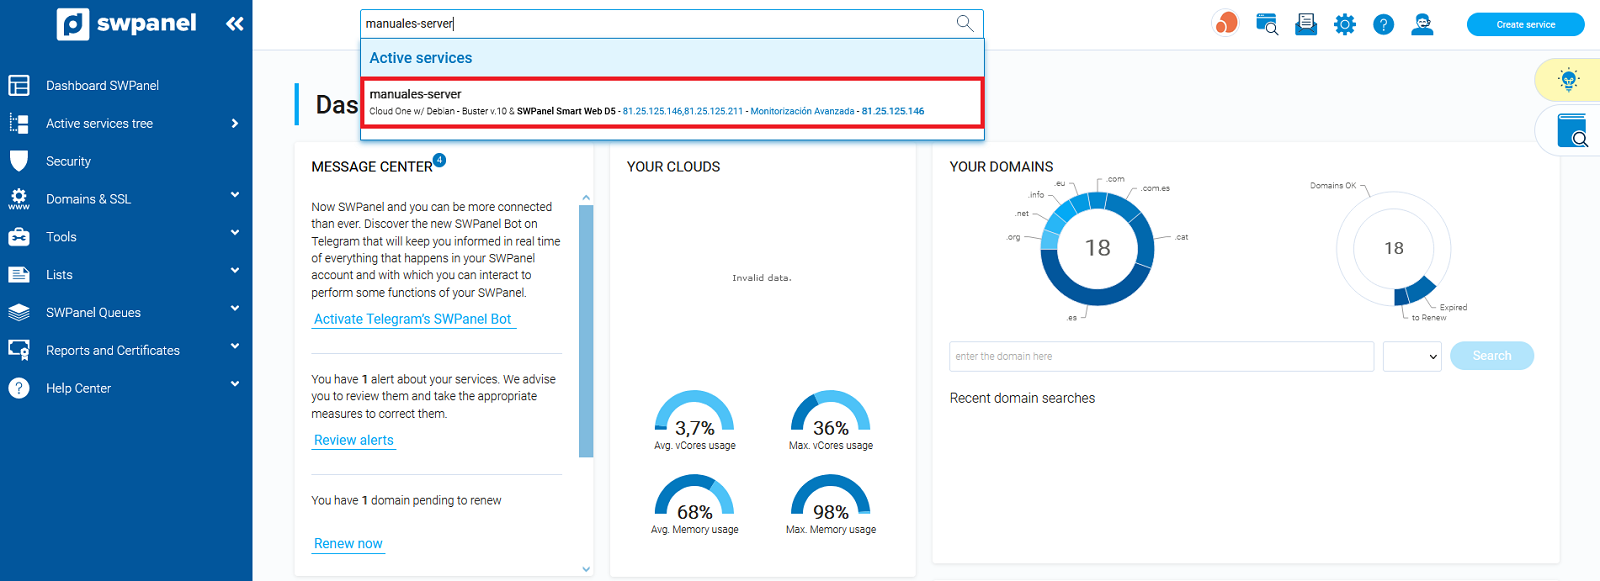
1. Within your SWPanel use the search engine to find your Cloud, in our case it is called manuals, yours will have a different name. Once you find it, select it.

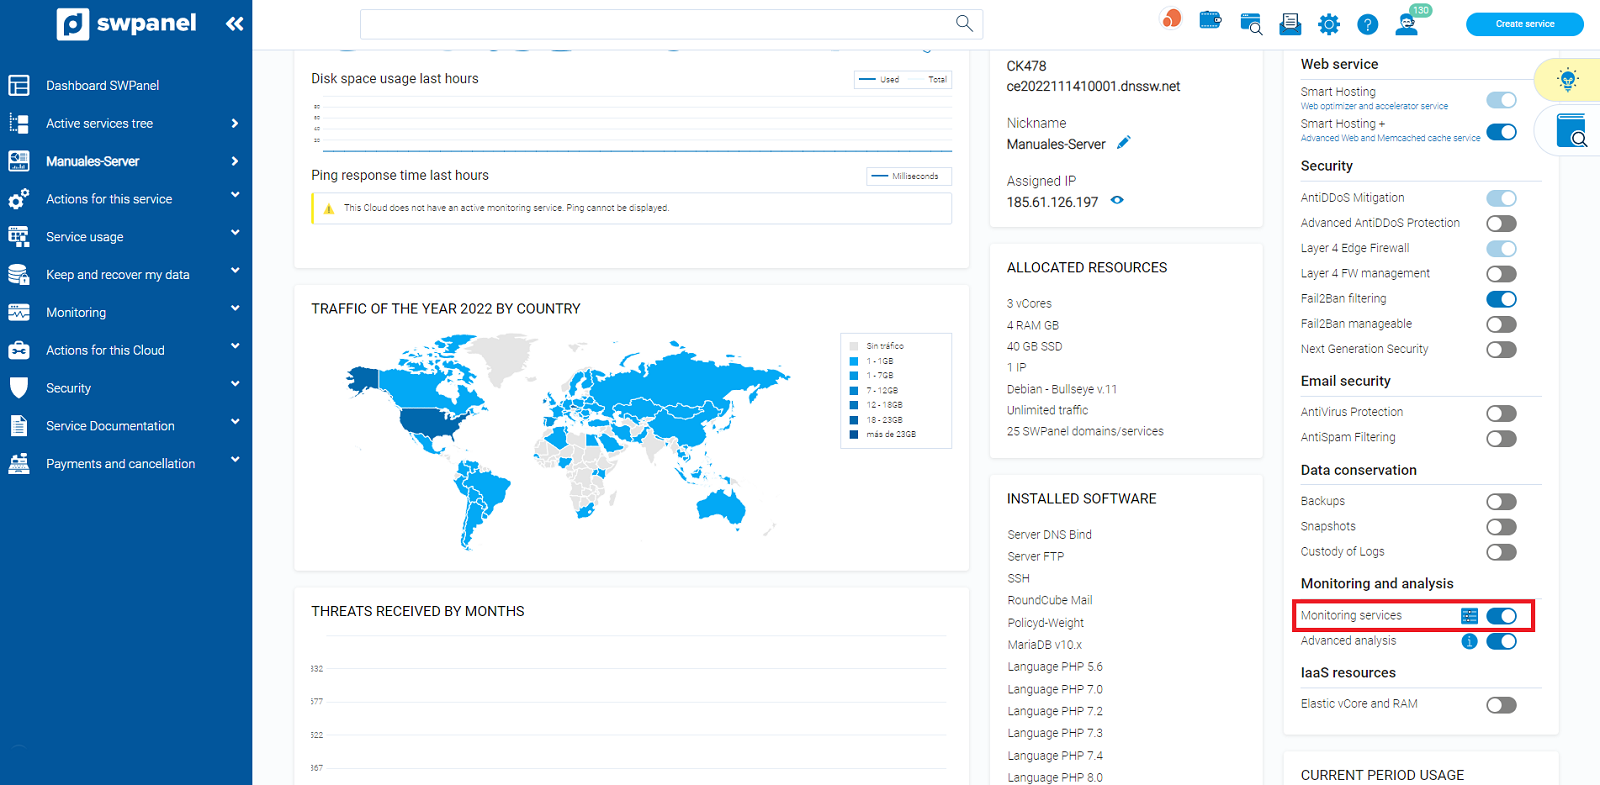
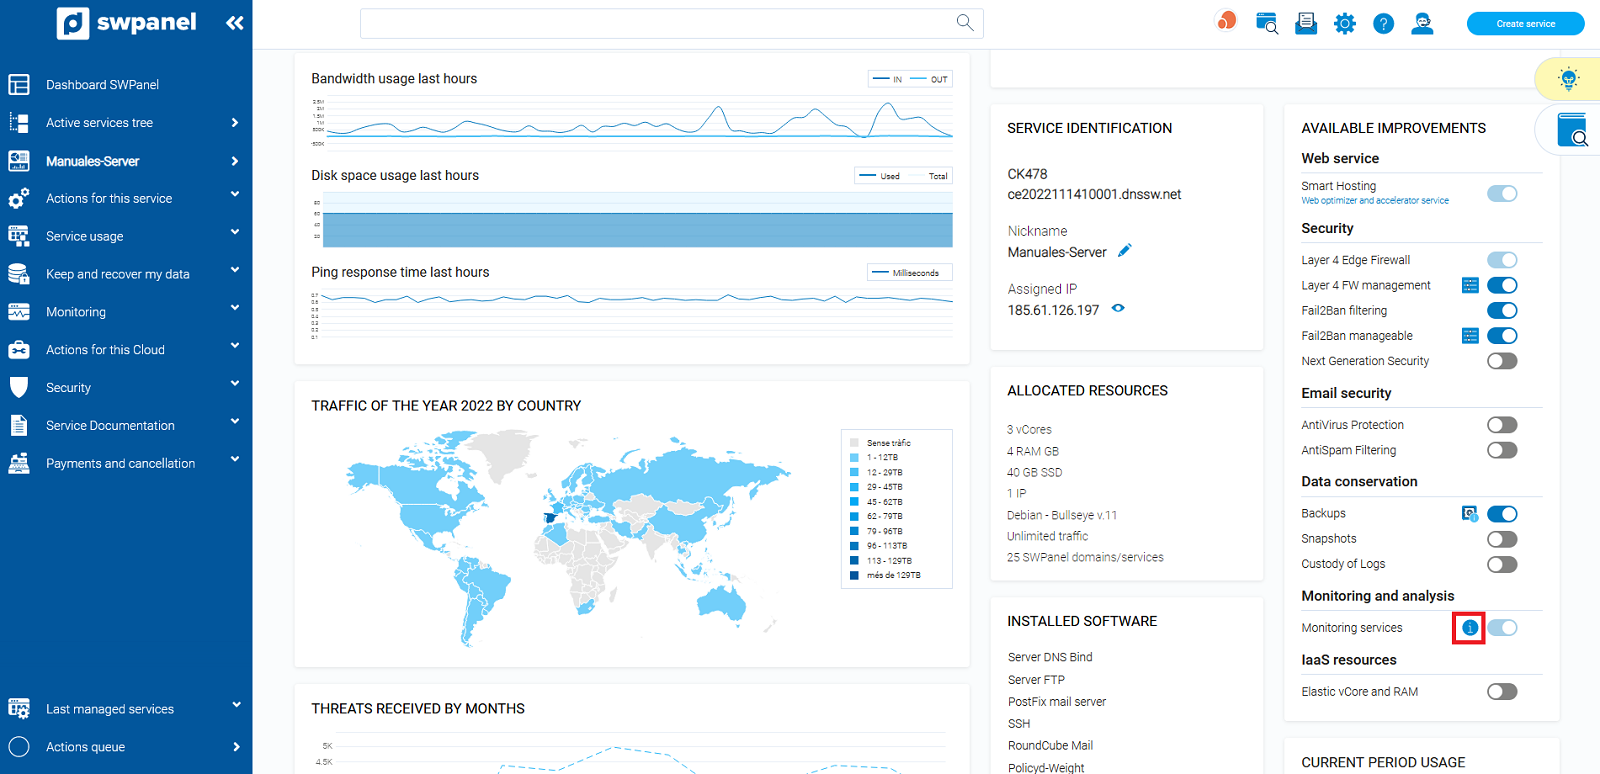
2. Next, we activate Monitoring Service in the Monitoring section, as indicated in the image:

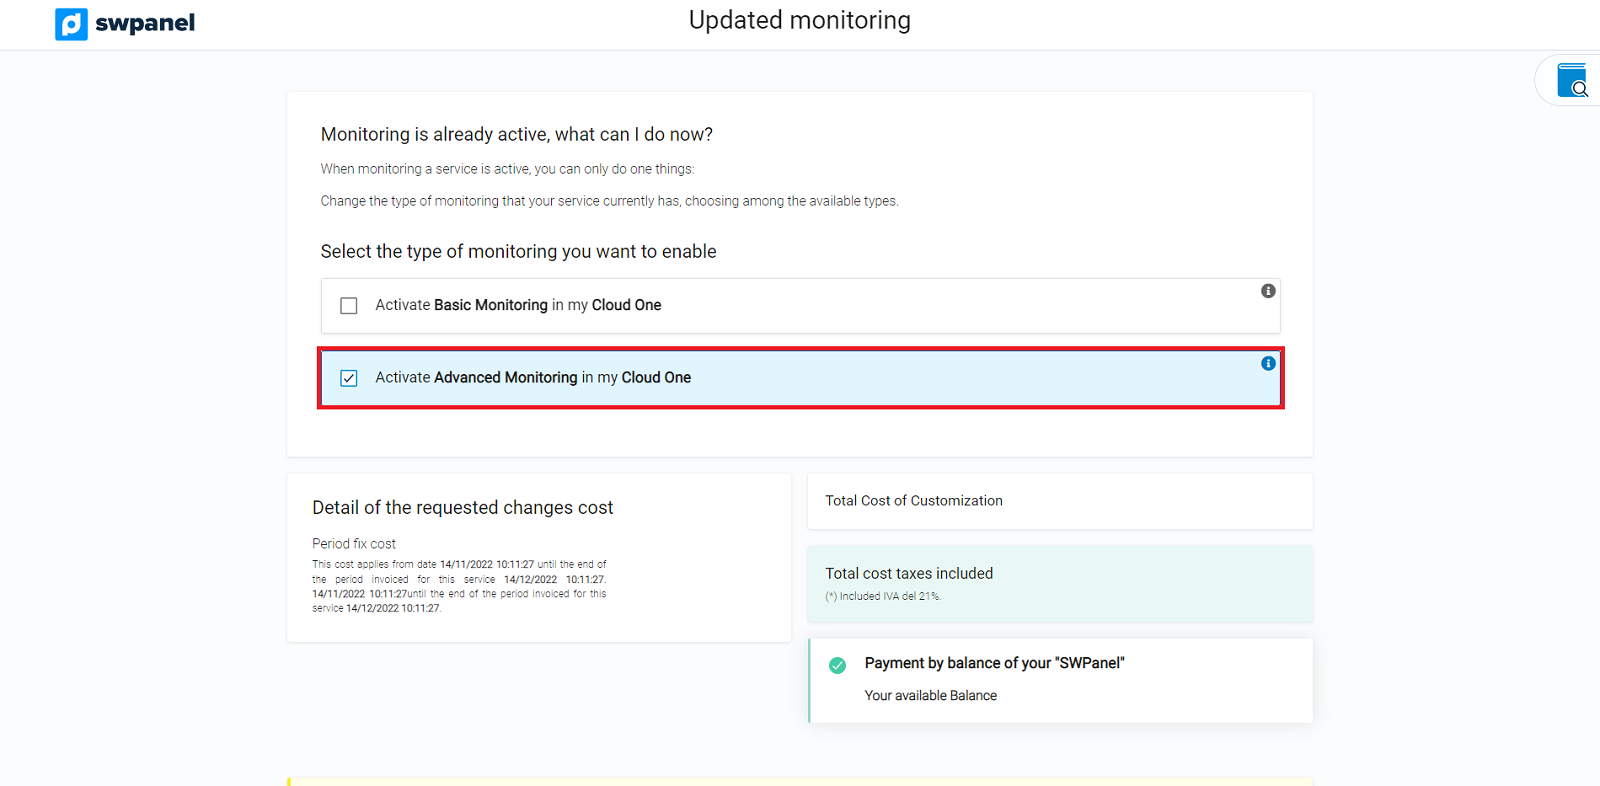
3. We select Activate Advanced Monitoring in Cloud One.

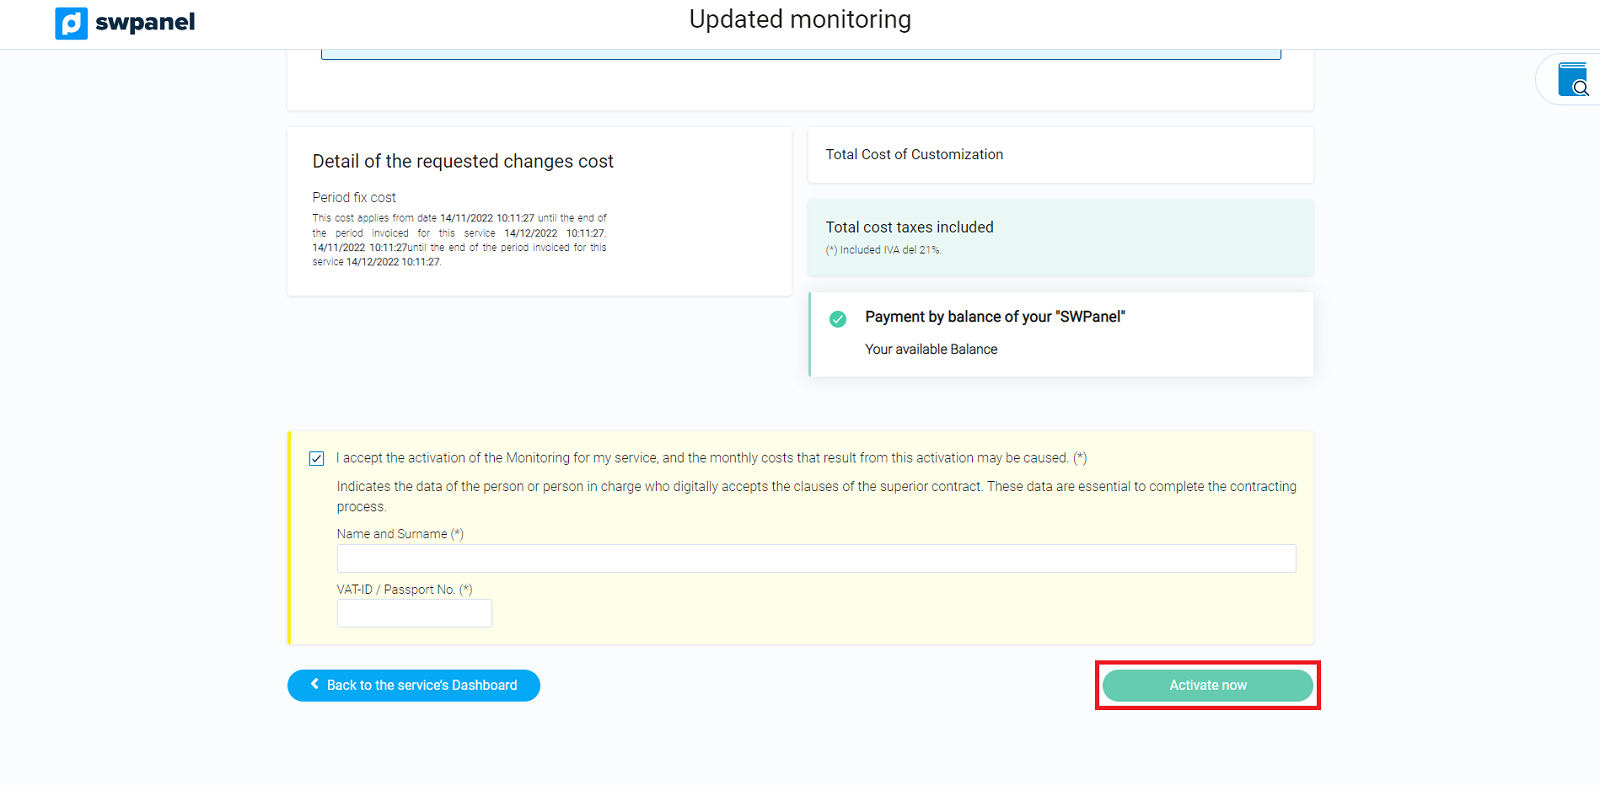
4. If you agree with the price, press "Activate now"

Advanced Monitoring activated!!!
cta:cloud_app_swpanel_smart_d5
How to view the Advanced Monitoring Dashboard
Press the icon marked in the next screenshot.

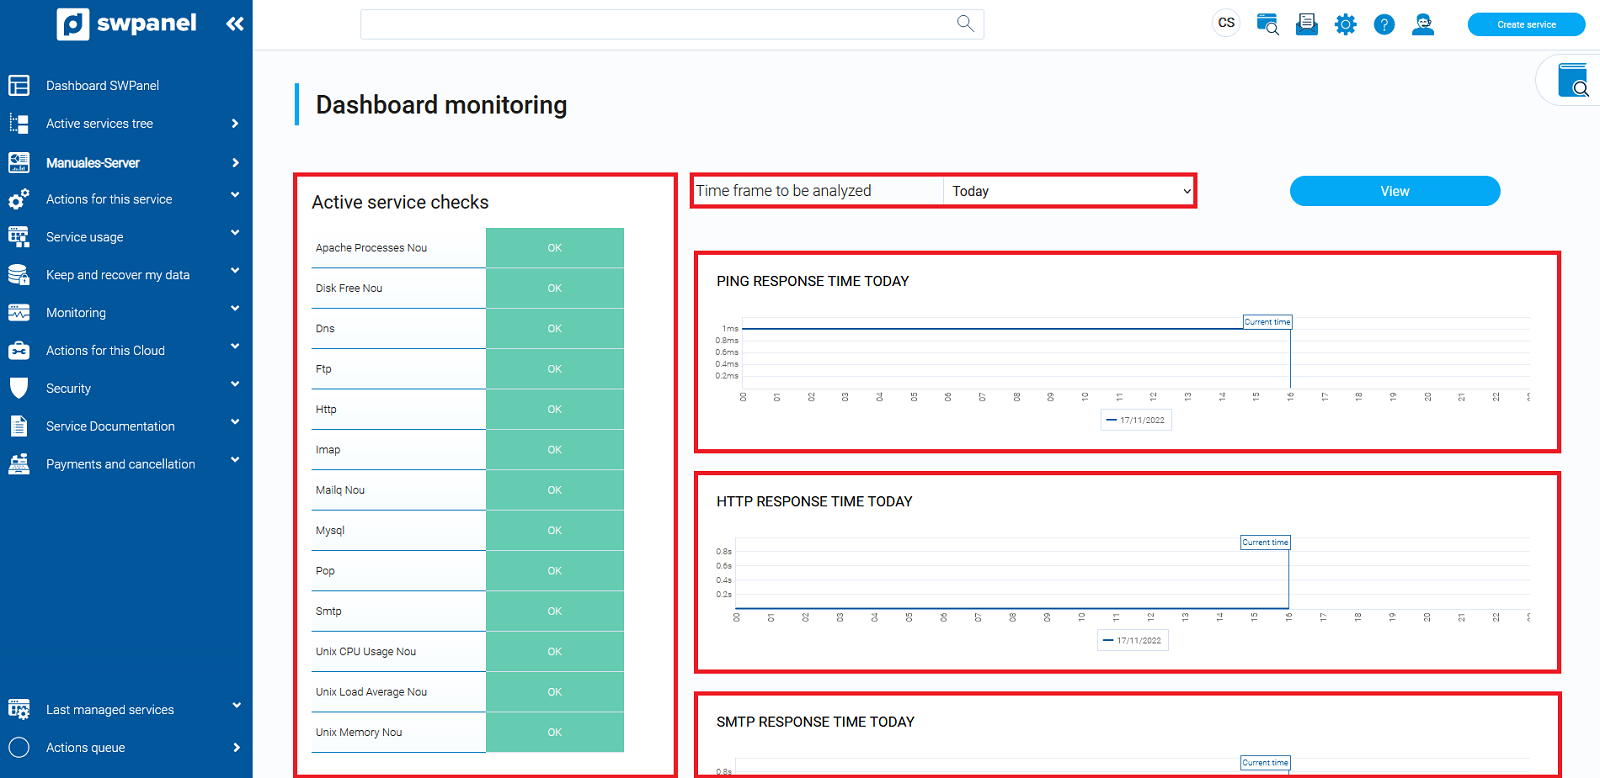
This is the Advanced Monitoring Dashboard:

Active service checks: All services that are being monitored and their current status.
Period of time to analyze: You can choose between today, last week, last month and between two days.
You will have the following graphs:
- Response time to the PING of the last week.
- Response time to HTTP in the last week.
- Response time to SMTP in the last week.
- Response time to POP3 in the last week.
- Response time to IMAP4 of the last week.
- Maximum number of emails in the dispatch queue in the last week.
- CPU Load Average for the last week.
- Percentage of RAM memory usage for the last week.
If you have any questions, you can contact us through the Support Wall
cta:cloud_app_swpanel_smart_d5
