Content
Categories
- General SWPanel (38)
- Administration (14)
- Database (14)
- SSL Certificates (15)
- Cloud (59)
- Cloud Storage (2)
- Containers (1)
- Backup Copies (6)
- Mail (33)
- DevOps (55)
- Domains (33)
- FTP (6)
- Hosting (32)
- Migrate Services (6)
- DNS Registers (13)
- Security (12)
- Services (7)
- Support (5)
- Users and privileges (2)
- Web (15)
- WordPress (23)
Dashboard of a service in SWPanel
A Dashboard, in IT, is usually a control tool focused on monitoring operational variables. This means that it displays metrics that pertain to a certain area or specific activities.
The indicators shown on a Dashboard generally represent operational processes. For example, the SWPanel will show the services you have contracted or the domains, among others. As it is based only on indicators that show the content you have in your portfolio, it offers a simple and quick view of your services.
The periodicity is usually in short and short periods of time, which shows the efficiency and effectiveness of a Dashboard showing the information that is most convenient to know.
The information displayed by the Dashboard will vary depending on the services you have contracted: Cloud servers, hosting...
Cloud service Dashboard
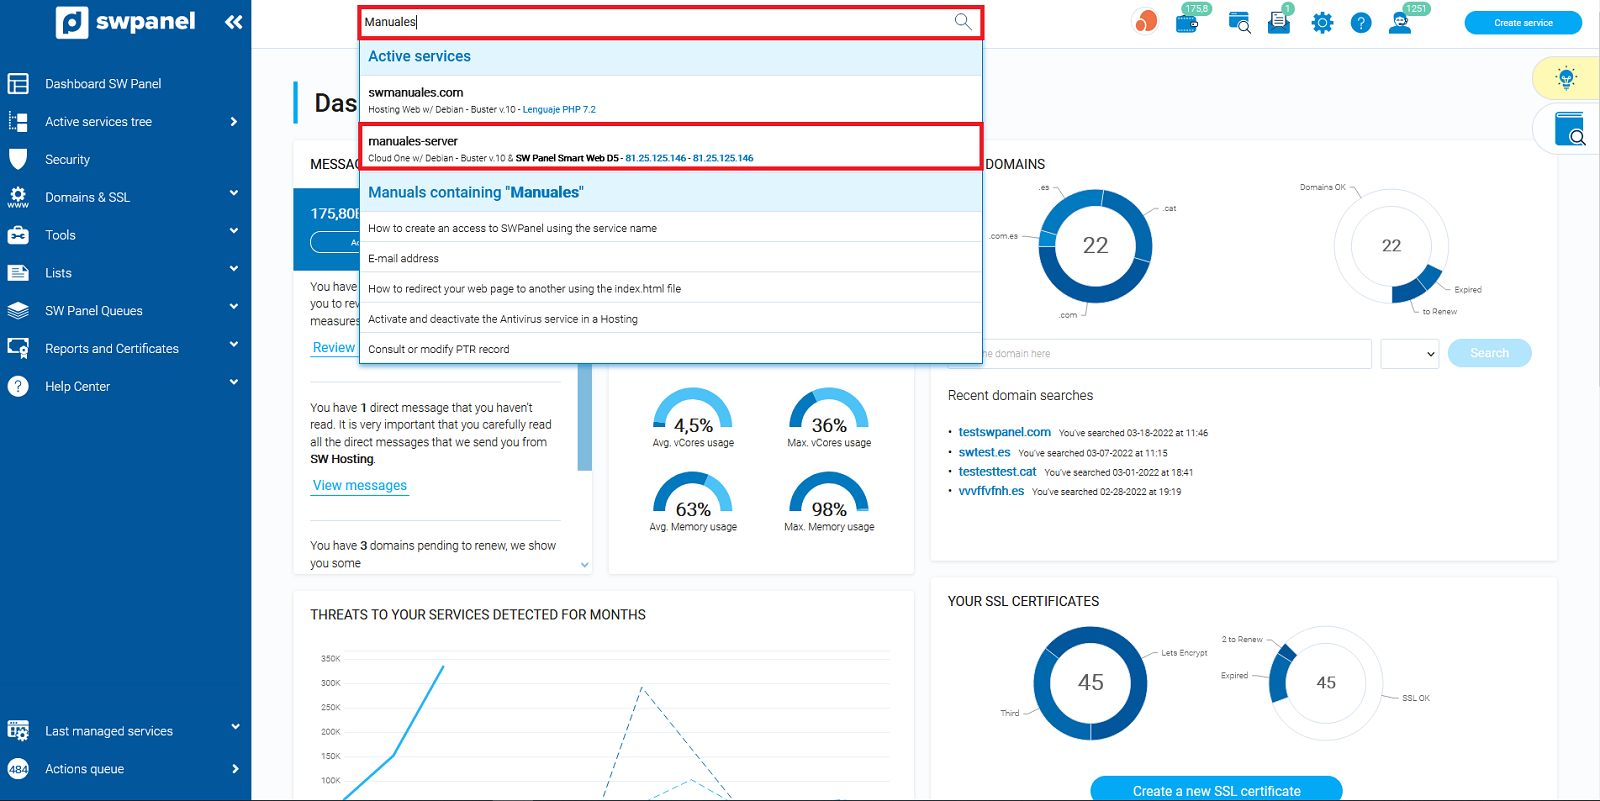
To access the Dashboard of your Cloud server, you must first locate it through the service search window of your SWPanel. Once you have located the name of your Cloud server, click on it:

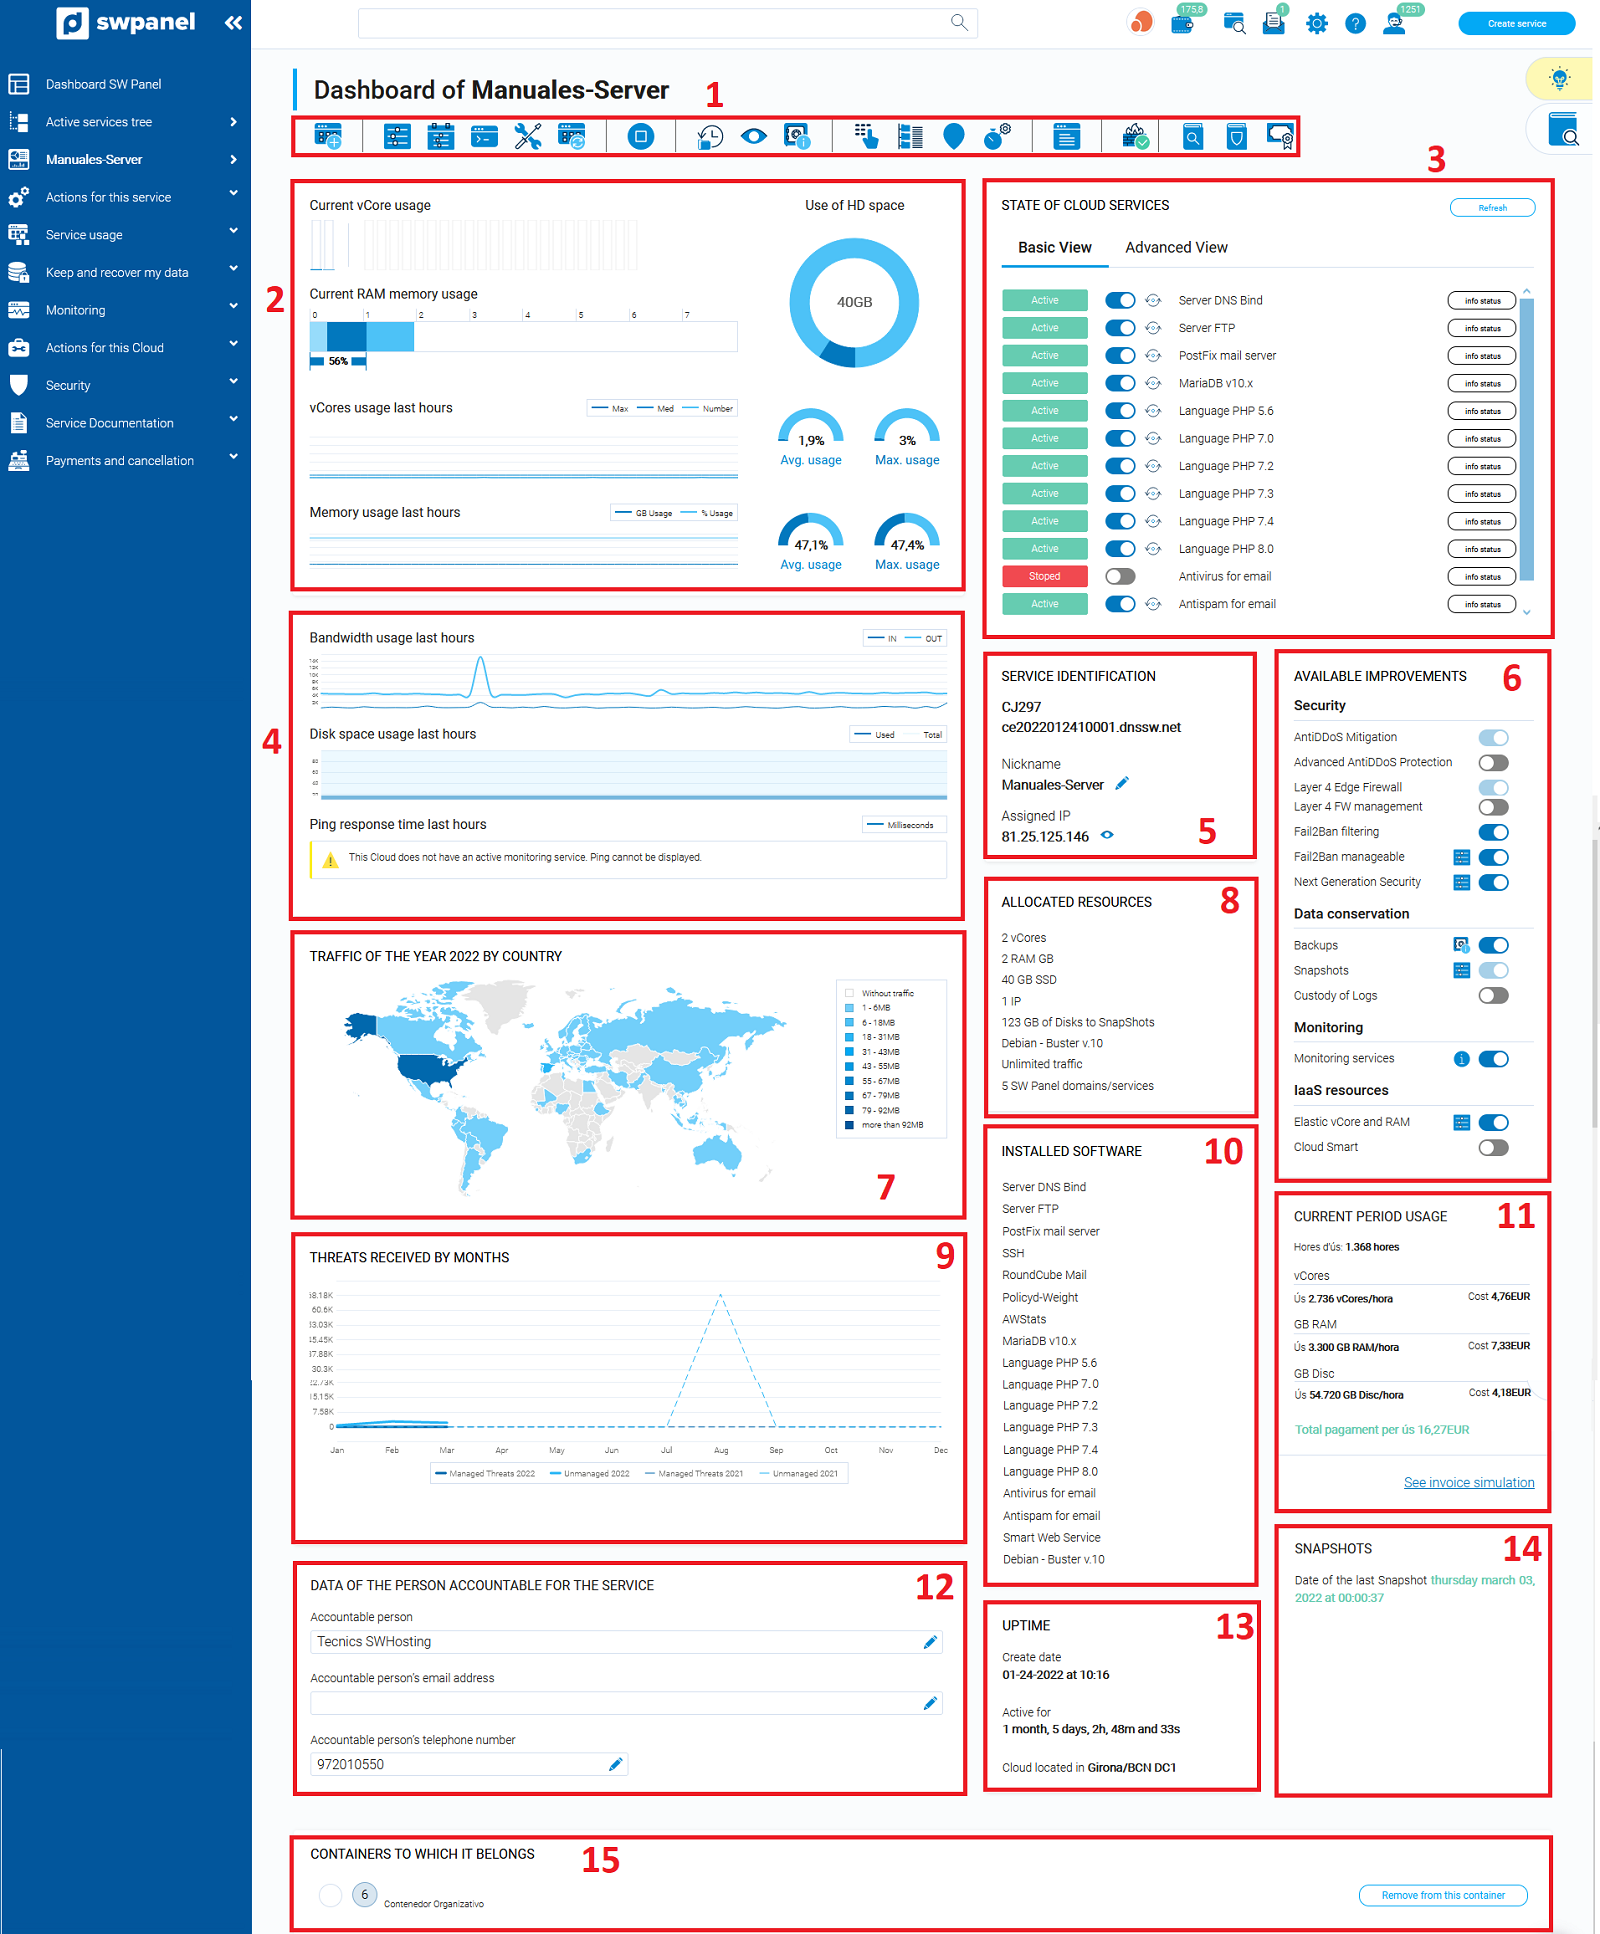
You will then access the server Dashboard where you will find the following information blocks or functionalities:

1. Icons of specific functions and configuration of your Cloud.
In this block you will find the icons corresponding to the following functions:
-
Create a new service in this accumulator: This is a shortcut to create a new Web Hosting, Redirected or Mail service.
-
Customize and adjust the resources and services of this Cloud: In this section you will be able to modify all the resources assigned to your cloud, you will also be able to modify the different extras available.
-
Create a planned scaling for this Cloud: In this section you will be able to define the increase or reduction of resources in a programmed time.
-
Adjust the basic parameters of the service: In this section you will be able to define the configuration of the different services installed in the cloud.
-
Manage the updates of the Operating System, software and installed services: In this section you can define the updates of your Cloud server, whether you want them to be automatic or manual.
-
Start / Stop the Cloud: The utility of this icon is to start or stop the cloud depending on its status, in the stop section, you can define normal or forced.
-
Make a Snapshot: By clicking on this icon, you will be able to create an image of the current state of your Cloud.
-
View Snapshot: You will be able to view the Snapshots taken on your Cloud server.
-
Define the directories to be backed up: In this section you can define the backup of your hosts as well as the different directories found in your Cloud.
-
Access the permissions manager: In this section you can manage the read/write permissions of your Cloud server.
-
Access the file manager: You will be able to explore and perform actions directly on the directories and files of your Cloud.
-
Manage the IPs associated to your Cloud: In this section you will be able to consult your IPs, the subnet mask, manage DNS records and modify the PTR record.
-
Cron Management: In this section you will be able to create different crons and define when you want to run them.
-
Logs Management: You will be able to visualize the different system logs (PHP, FTP, Syslog, Kernel...).
-
Activate Layer 4 FW Management: In this section you will be able to activate the layer 4 firewall of your Cloud.
-
Usage History: In this section you will be able to see the usage history of all your Cloud resources.
-
On system vulnerabilities: In this section you can generate a report of the different vulnerabilities detected in your system.
-
New Generation Security Analysis: You will be able to request a Cybersecurity report of your Cloud server.
-
Issue a certificate on this service: In this section you can generate a certificate of the location of the data as well as the certificate of data protection ISO27001.
2. Resources usage summary
In this section you will be able to see the resource usage by percentages, such as vCores usage, RAM memory and disk space.
3. Identification of the status of the Cloud services
In this section you will be able to see the main Cloud server services and check their status, start or stop them according to your needs.
4. Bandwidth and disk usage
In this section you will be able to see the bandwidth used in the last hours, as well as the disk space.
5. Service identification
In this section you will be able to see the service code for a better identification for the SW Hosting technician. You will also be able to see the cloud name (PTR) and the defined alias.
6. Available upgrades
In this section you will be able to see the different extras activated in your cloud, by clicking on the switch located on the right side, you will be able to activate or deactivate it depending on its status.
7. Current year's traffic by country
In this section you will be able to see the origin of the traffic that has made requests to your Cloud server.
8. Allocated resources
In this section you will be able to see the defined resources of your Cloud.
9. Threats received by month
From here you will be able to see a graph of the threats treated and not treated. This graph may vary depending on the security contracted.
10. Software installed
In this section you will be able to see all the installed operating system and all your services.
11. Current period usage
In this section you can see the time of use of your cloud. You will also be able to know the cost of your cloud, by clicking on "View invoice simulation " . You will be able to see both the costs at the date of the consultation and the monthly costs, this amount may vary depending on the resources you allocate or reduce during the period.
12. Data of the person responsible for the service
In this section you will be able to see the name, email and telephone number of the person in charge.
13. Uptime
In this section you can see the day the Cloud was created and the time it has been started since the last start.
14. Snapshots
In this section you can see the snapshots performed.
15. Containers it belongs to
In this section you can see the containers to which your cloud belongs.
16. Planned scaling for this cloud
In this section you will be able to see all the planned scalings and create a scaling with the cursor.
Dashboard of a Hosting service
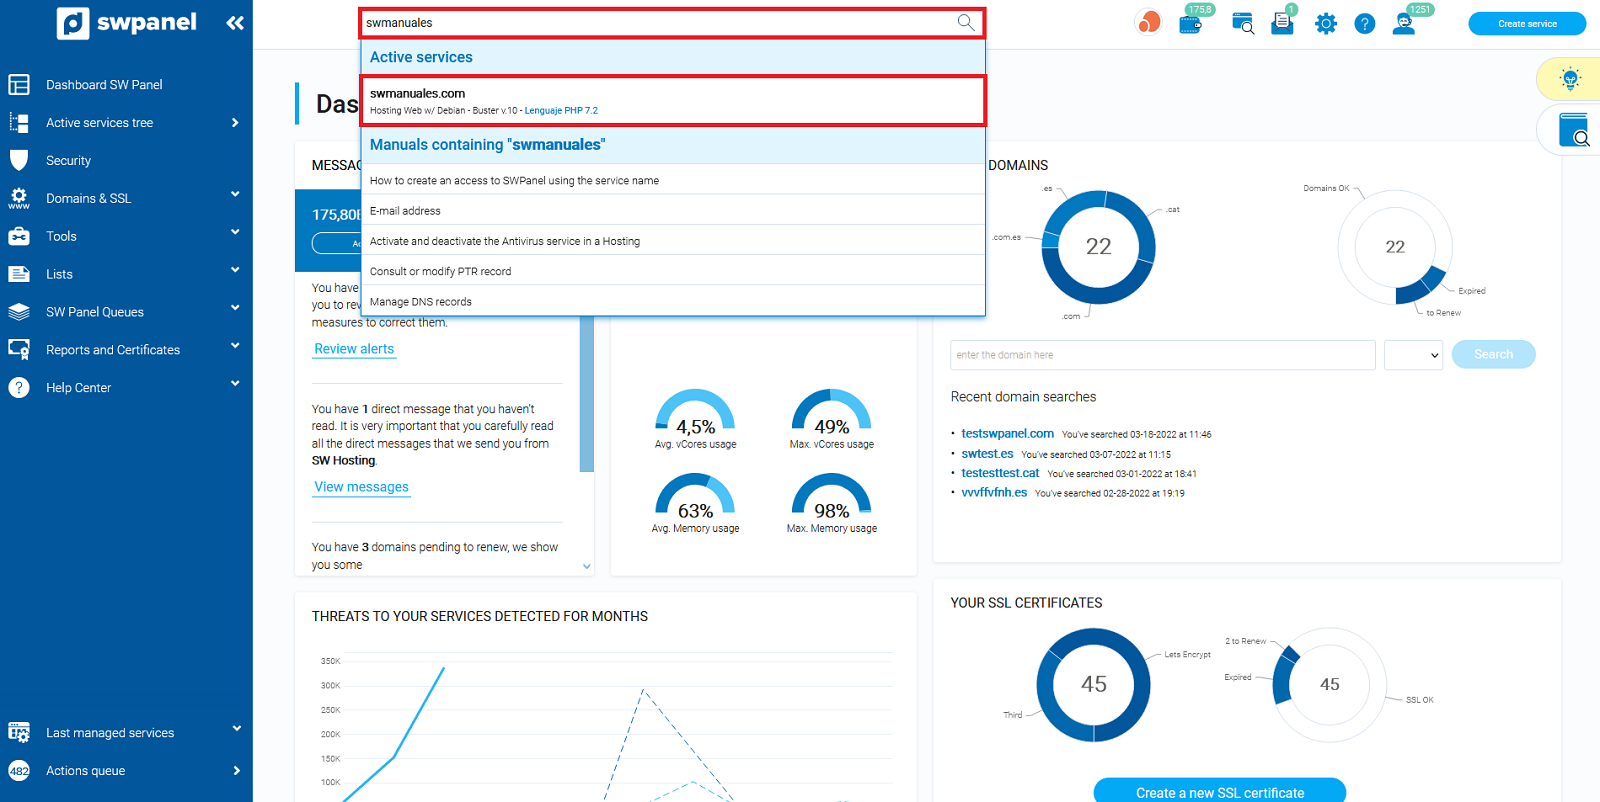
To access the Dashboard of your hosting service, you must first locate it through the service search window of your SWPanel. Once you have located the name of your hosting service, click on it:

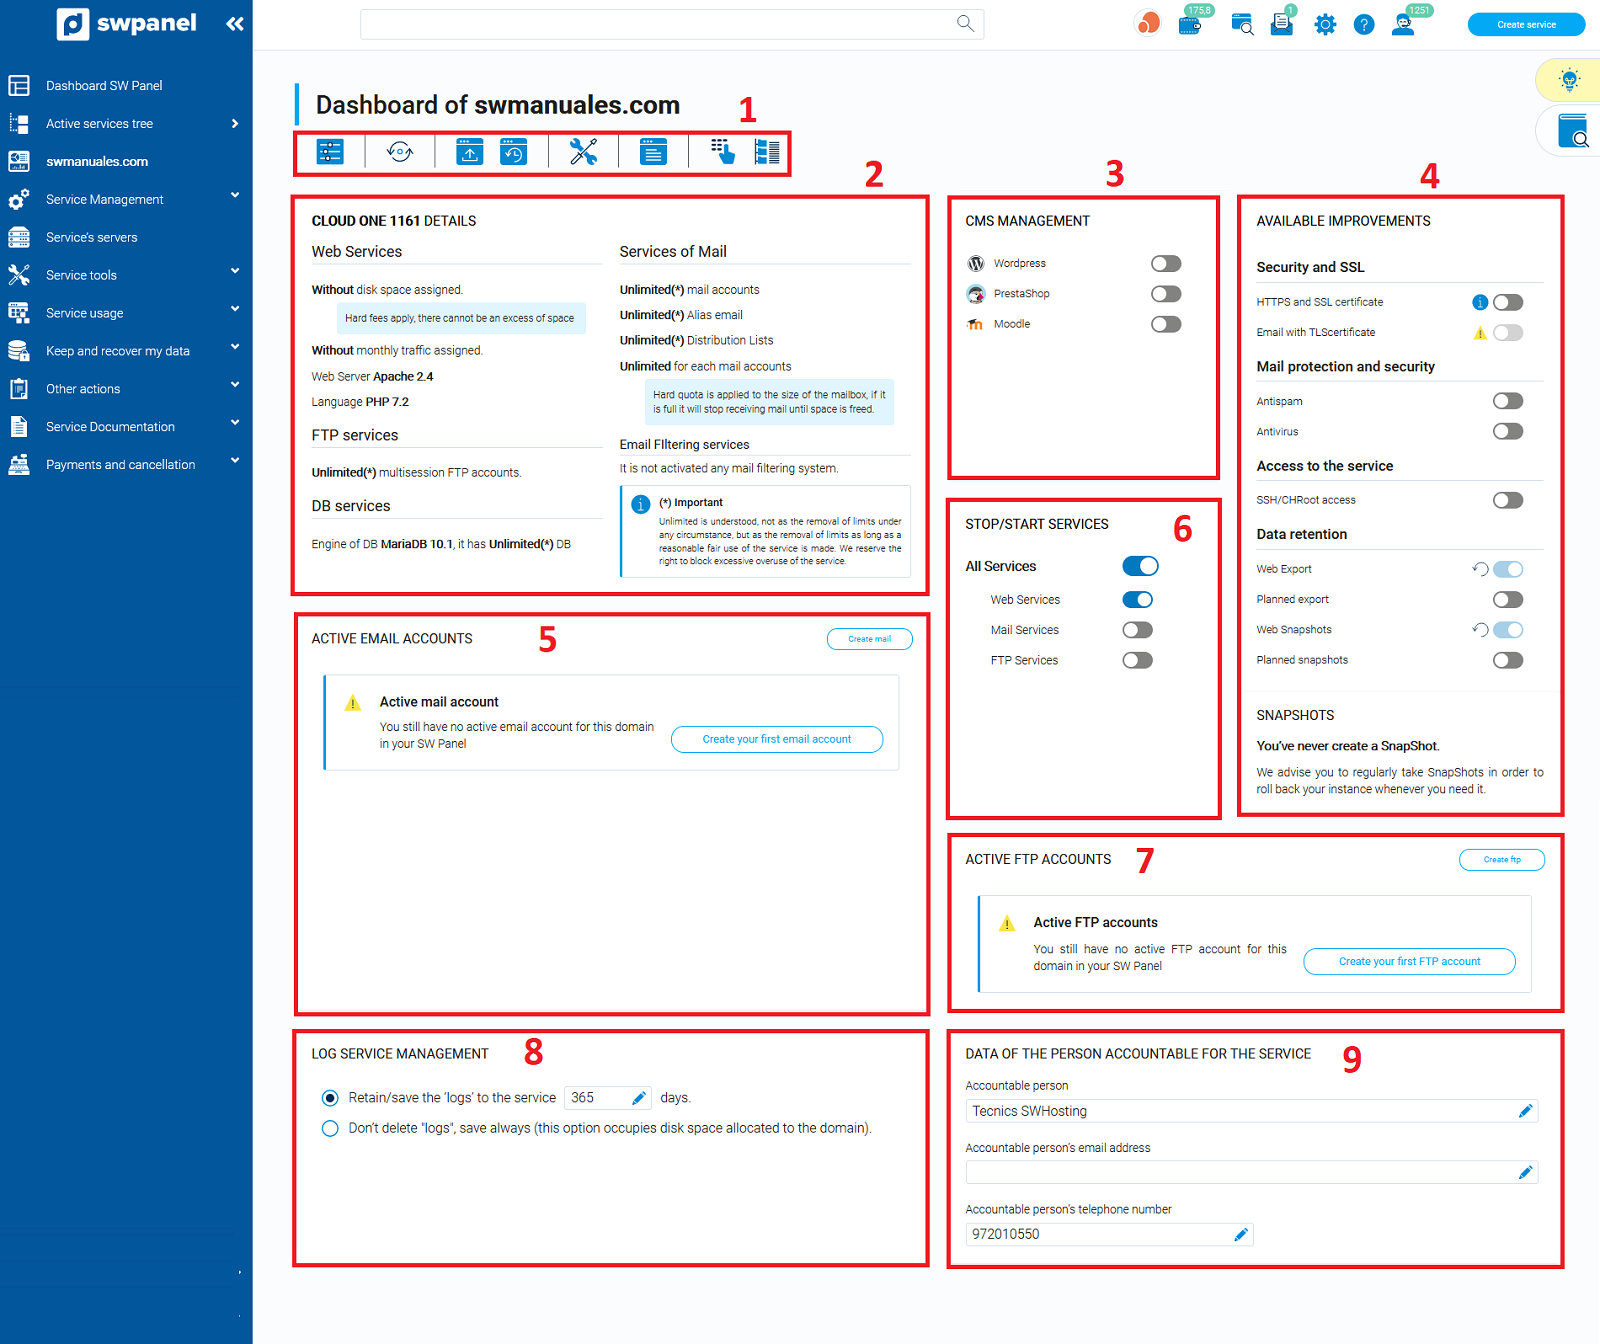
Then you will access the hosting service Dashboard, where you will find the following information blocks or functionalities:

1. Icons of specific functions and configuration of your Hosting
In this block you will find the icons corresponding to the following functions:
-
Adjust the parameters and complements of your Hosting plan: In this section you will be able to customize the software or services installed in the service.
-
Change the hosting plan assigned to this service: In this section you will be able to change to a superior plan or change the servers assigned to the service.
-
Make a Web export now: Export your Web by e-mail or to an external FTP server.
-
Make a Web SnapShot now: This takes place in real time and copies the Web and DB content. Does not include e-mail and logs.
-
Basic parameter settings: In this section you will be able to modify parameters of the Nginx web server and the PHP configuration file of the service.
-
Manage the logs of the service: You will be able to visualize the access and error events of your Hosting.
-
Permissions manager: You will be able to manage the read/write permissions of your Hosting service.
-
File manager: You will be able to explore and perform actions directly on the directories and files of your Hosting service.
2. Web Hosting Details
In this section you will be able to see all the detailed configuration of your Web Hosting.
3. CMS Management
In this section you will be able to install and uninstall the different content management systems (CMS) available automatically, creating the necessary FTP accounts and databases. Upon installation, the access credentials will be sent to your email.
4. Available Enhancements
In this section you will be able to activate or deactivate different optional configurations.
5. Active email accounts
In this section you can see a list of the active email accounts, you can modify them from the [ --- ] menu that appears to the right of the email account. You can also create a new account by clicking on the "+" icon.
6. Stop/Start services
In this section you can activate or deactivate the different services of your hosting service.
7. Active FTP accounts
In this section you can see a list of the active FTP accounts, you can modify them from the menu [ --- ] that appears to the right of the email account. You can also create a new account by clicking on the "+" icon.
8. Service logs management
In this section you can manage how long you want to keep the logs of your service.
9. Service manager
In this section you will be able to see and modify the name, e-mail and telephone number of the person in charge of the service.