Content
Categories
- General SWPanel (36)
- Administration (27)
- Database (13)
- SSL Certificates (15)
- Cloud (57)
- Cloud Storage (2)
- Containers (1)
- Backup Copies (6)
- Mail (33)
- DevOps (54)
- Domains (33)
- FTP (6)
- Hosting (31)
- Migrate Services (4)
- DNS Registers (11)
- Security (11)
- Services (8)
- Support (5)
- Users and privileges (2)
- Web (10)
- WordPress (23)
How to review the event log of your website
To check your website's event log, you can follow the steps below:
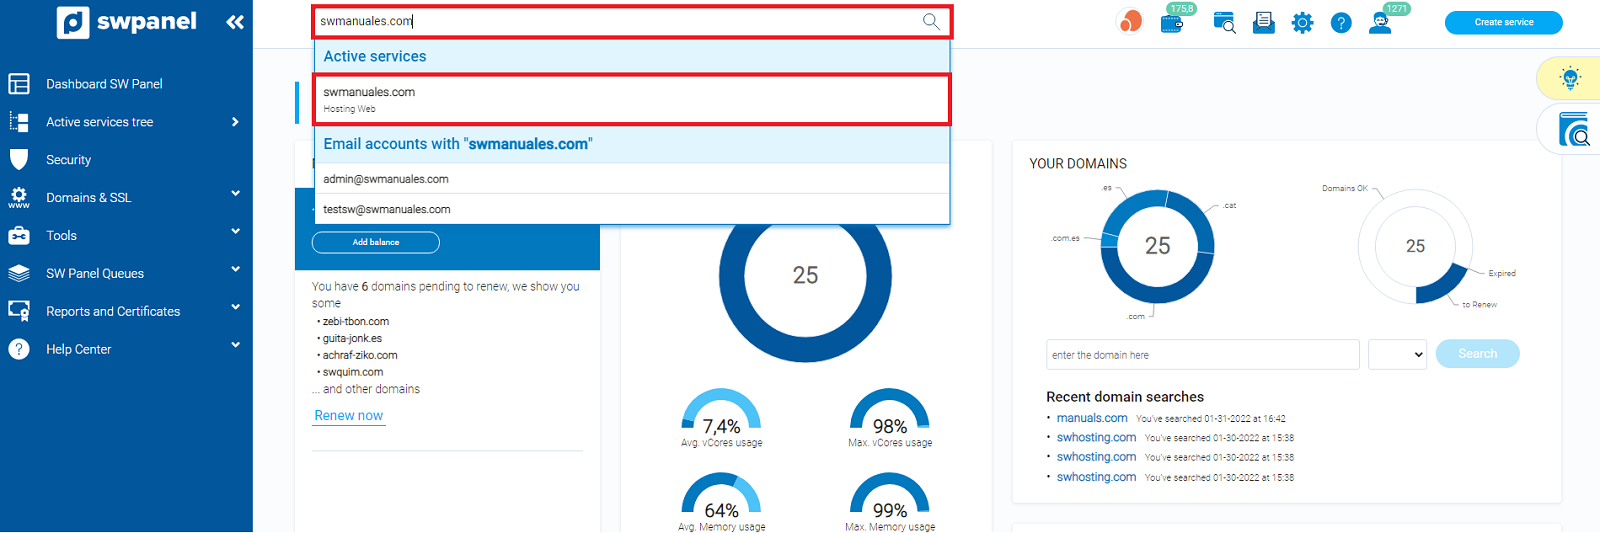
1- Log in to the SWPanel and go to the Dashboard of the corresponding service, using the search engine at the top.
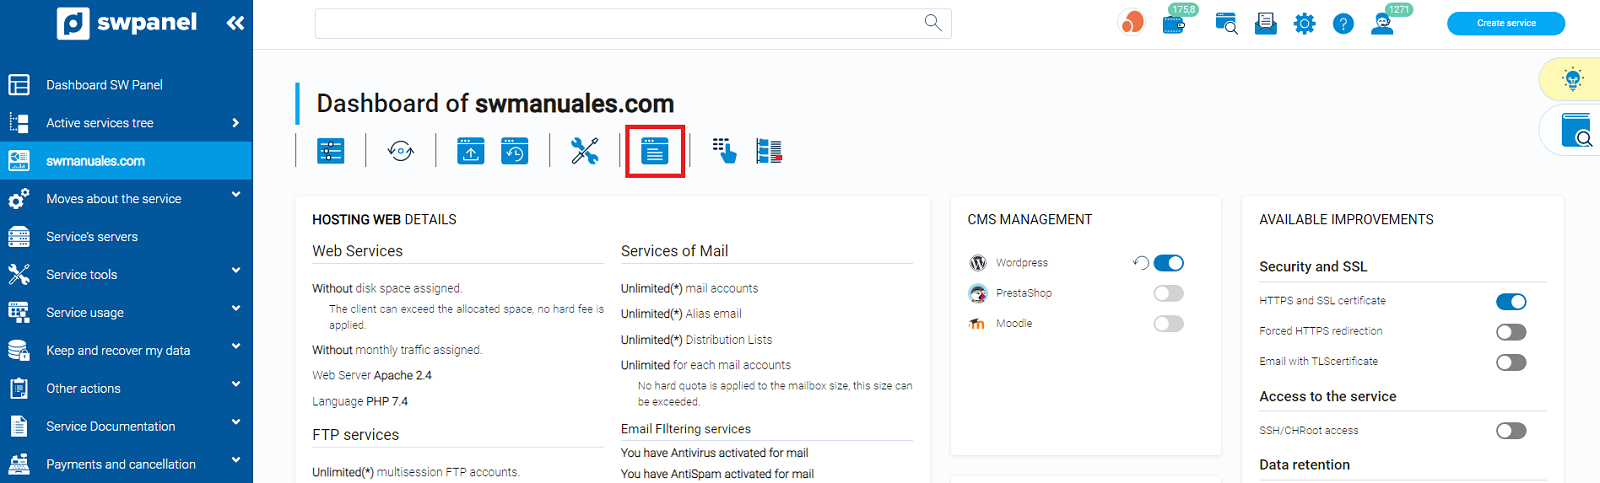
2- Once you are in the Dashboard of your service, go to the LOG Manager using the LOGs icon.
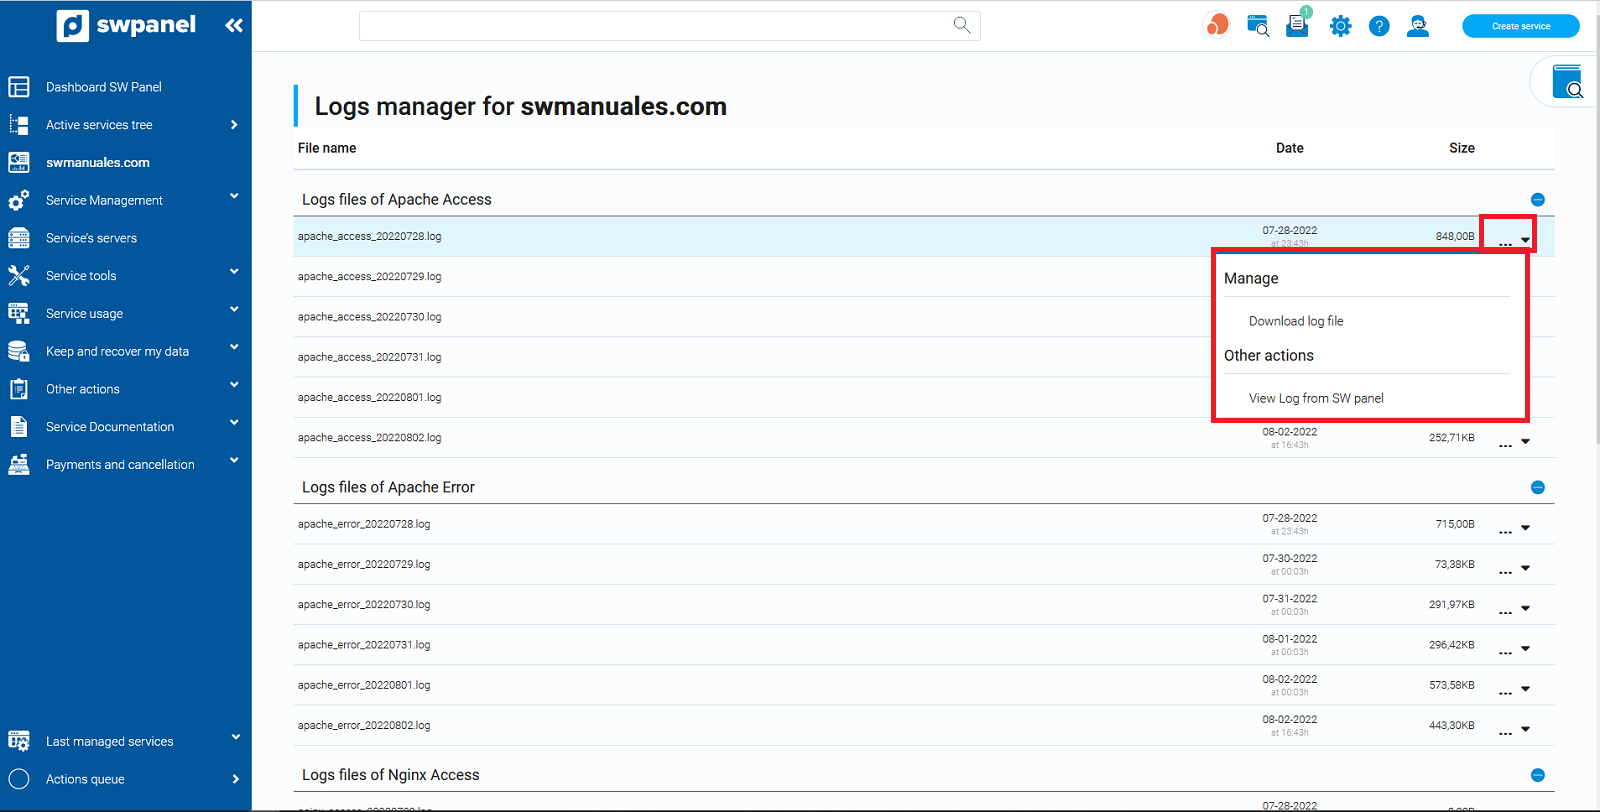
You will then see four different types of files: Apache Access, Apache Error, Nginx Access and Nginx Error:
-
apache_access_XXXXXXXXXXXXXX.log - The server stores information about all requests it processes, the location of the log file and the content that is logged in the access log.
-
apache_error_XXXXXXXXXXXXXX.log - The Apache error log is where you record information about any errors or anomalies you encounter. Many of the "errors" in the Apache logs are usually minor, such as a visitor requesting a file that does not exist. Apache also uses error logs to record warnings that may indicate a potential problem with a particular event or configuration.
-
nginx_access_XXXXXXXXXXXX.log - In this file you will see the requests made by the Nginx service against your web service (cache).
-
nginx_error_XXXXXXXXXXXXXX.log - The server stores the information about all the requests of the Nginx service with error, against your web service in this error log.
cta:hosting
The way to view any of the 4 types of logs that we have just discussed is the same as the following example.
3- Select the drop-down menu [...] and select "Download" or "View Log from SWPanel". If the log file is too large, the option "View Log from SWPanel" will not be available.
4- If you open it using the SWPanel, it will look like this.
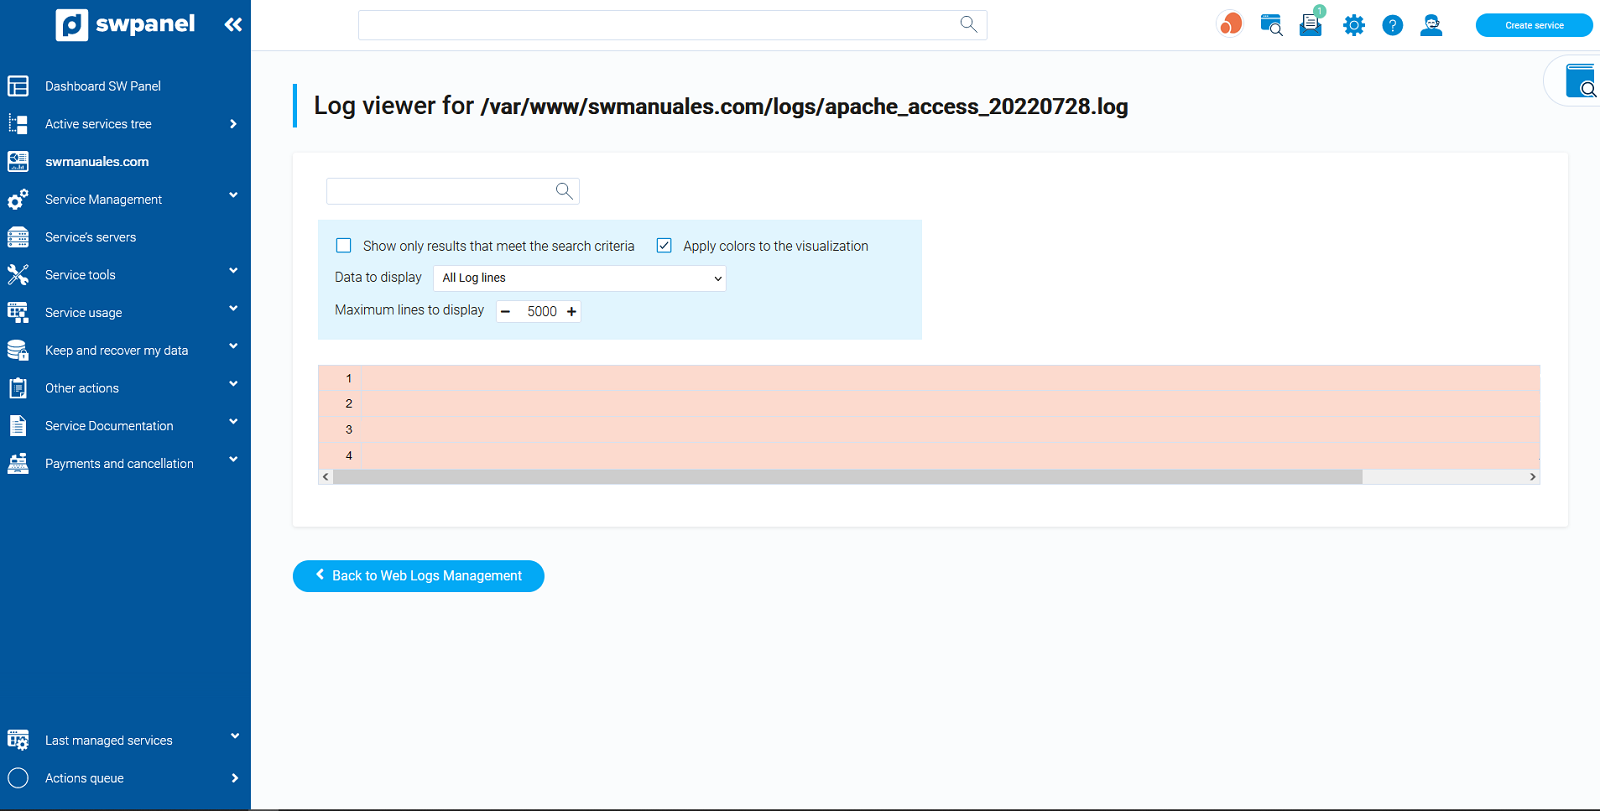
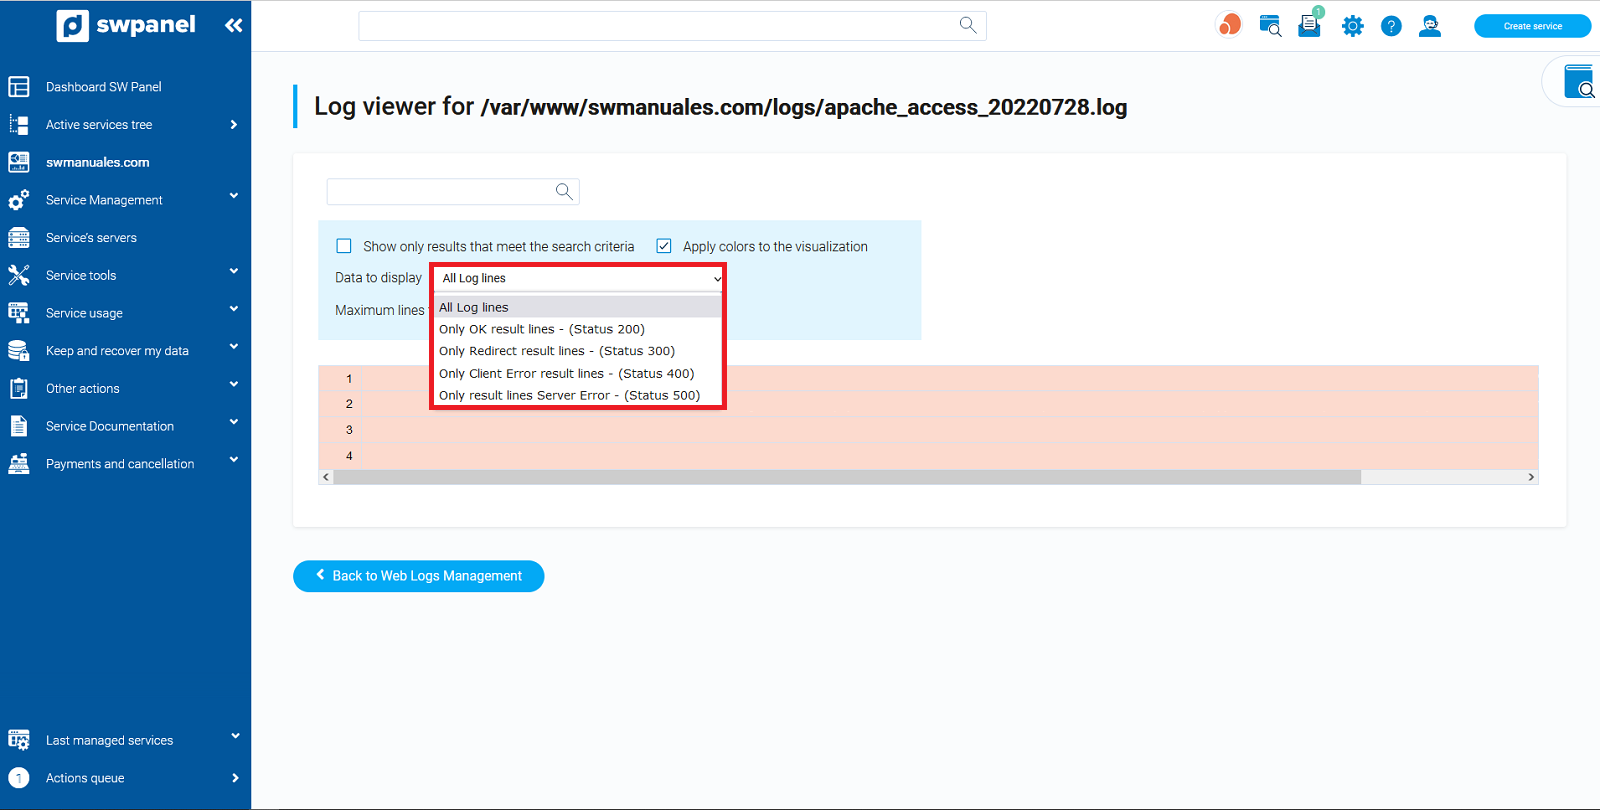
5- In the option "Data to display", you can choose between the following options, to filter and search only for the specific code.
-
All log lines: --> Default option.
-
Only lines Result Ok - (Status 200) --> Filter only the lines containing status 200, the request has succeeded
-
Redirect Result lines only - (Status 300) --> Filter only lines containing status 300, equivalent to redirects.
-
Only lines Result Client Error - (Status 400) --> Filter only lines containing status 400, equivalent to client errors.
-
Only lines Result Server Error - (Status 500) --> Filter only the lines containing status 500, equivalent to server errors.
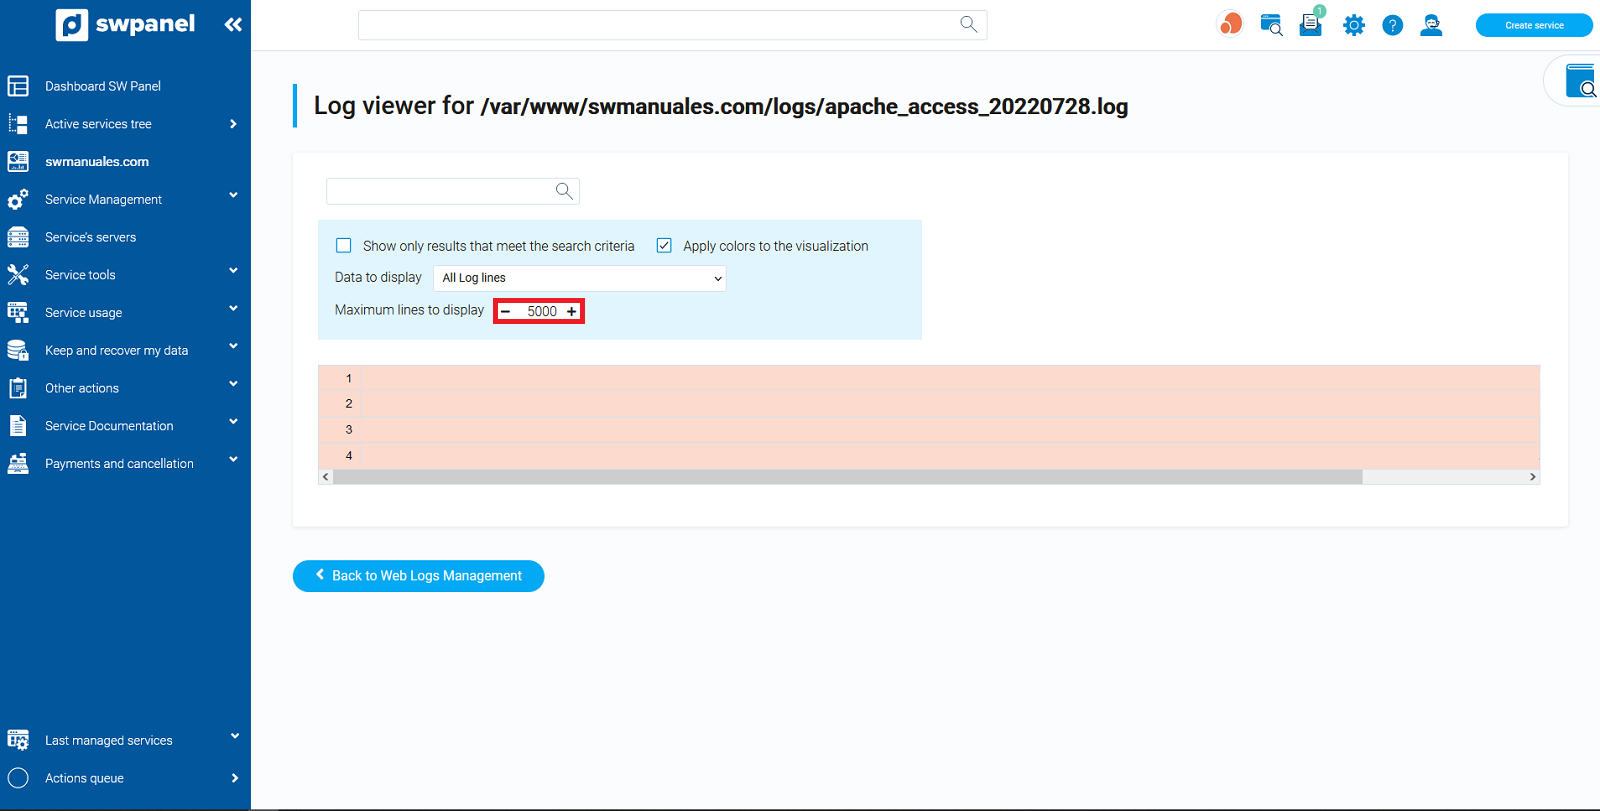
6- Also, you can choose the maximum number of lines to display, by default it is 5000, although you can modify it. You only have to write in the box the number of lines you want and press the "Enter" button.
If you have any questions about this, feel free to use our support wall.
cta:cloud_app_swpanel_smart_d5